
NDVI 的计算原理和适用场景
NDVI 的计算原理
NDVI(归一化植被指数,Normalized Difference Vegetation Index)是一种用于评估植被覆盖和健康状况的遥感指数。它通过计算近红外波段(NIR)和红光波段(Red)的反射率差异来反映植被的分布和生长状况。
NDVI 的计算公式为:
NDVI= (NIR - Red)/(NIR + Red)
- NIR:近红外波段的反射率,植被在近红外波段有较高的反射率。
- Red:红光波段的反射率,植被在红光波段有较低的反射率。
NDVI 的取值范围为 [-1, 1]:
- NDVI > 0:表示有植被覆盖,值越大表示植被越茂密。
- NDVI ≈ 0:表示无植被覆盖(如裸土、水体)。
- NDVI < 0:通常表示云、雪或水体。
NDVI 的适用场景
- 植被监测:评估植被覆盖范围、健康状况和生长趋势。
- 农业管理:监测作物生长状况,指导施肥和灌溉。
- 生态环境评估:分析土地利用变化、森林砍伐和荒漠化。
- 灾害评估:评估洪涝、干旱等自然灾害对植被的影响。
代码注释说明
import rasterio # 导入 rasterio 库,用于读取栅格数据
import numpy as np # 导入 numpy 库,用于数组操作
import os # 导入 os 库,用于文件路径操作
from tqdm import tqdm # 导入 tqdm 库,用于显示进度条
import matplotlib.pyplot as plt # 导入 matplotlib 库,用于绘图
# 设置 matplotlib 的字体和符号显示
plt.rcParams["font.sans-serif"] = ["SimHei"] # 设置中文字体为 SimHei
plt.rcParams["axes.unicode_minus"] = False # 解决负号显示问题
def calculate_and_visualize_ndvi(red_band_path, nir_band_path, output_path, threshold=0.2):
"""
计算 NDVI 并可视化结果
:param red_band_path: 红波段文件路径
:param nir_band_path: 近红外波段文件路径
:param output_path: 输出文件保存路径
:param threshold: NDVI 阈值,用于区分植被和非植被
"""
print("开始计算NDVI...")
# 打开红波段和近红外波段文件
with rasterio.open(red_band_path) as red_src, \
rasterio.open(nir_band_path) as nir_src:
# 读取红波段和近红外波段数据,并转换为浮点型
red = red_src.read(1).astype(float)
nir = nir_src.read(1).astype(float)
# 创建掩膜,避免除以零
mask = (red + nir) != 0
# 计算 NDVI
ndvi = np.zeros_like(red) # 初始化 NDVI 数组
ndvi[mask] = (nir[mask] - red[mask]) / (nir[mask] + red[mask])
# 根据阈值提取植被区域
vegetation = np.where(ndvi > threshold, 1, 0)
# 保存 NDVI 结果
ndvi_file = f"{output_path}/NDVI结果.tif"
with rasterio.open(
ndvi_file,
'w',
driver='GTiff', # 文件格式为 GeoTIFF
height=red_src.height,
width=red_src.width,
count=1, # 单波段
dtype=np.float32, # 数据类型为浮点型
crs=red_src.crs, # 坐标系
transform=red_src.transform, # 变换矩阵
) as dst:
dst.write(ndvi.astype(np.float32), 1) # 写入 NDVI 数据
# 保存植被分布结果
veg_file = f"{output_path}/植被分布.tif"
with rasterio.open(
veg_file,
'w',
driver='GTiff',
height=red_src.height,
width=red_src.width,
count=1,
dtype=np.uint8, # 数据类型为 8 位无符号整数
crs=red_src.crs,
transform=red_src.transform,
) as dst:
dst.write(vegetation.astype(np.uint8), 1) # 写入植被分布数据
# 创建绘图窗口
plt.figure(figsize=(15, 10))
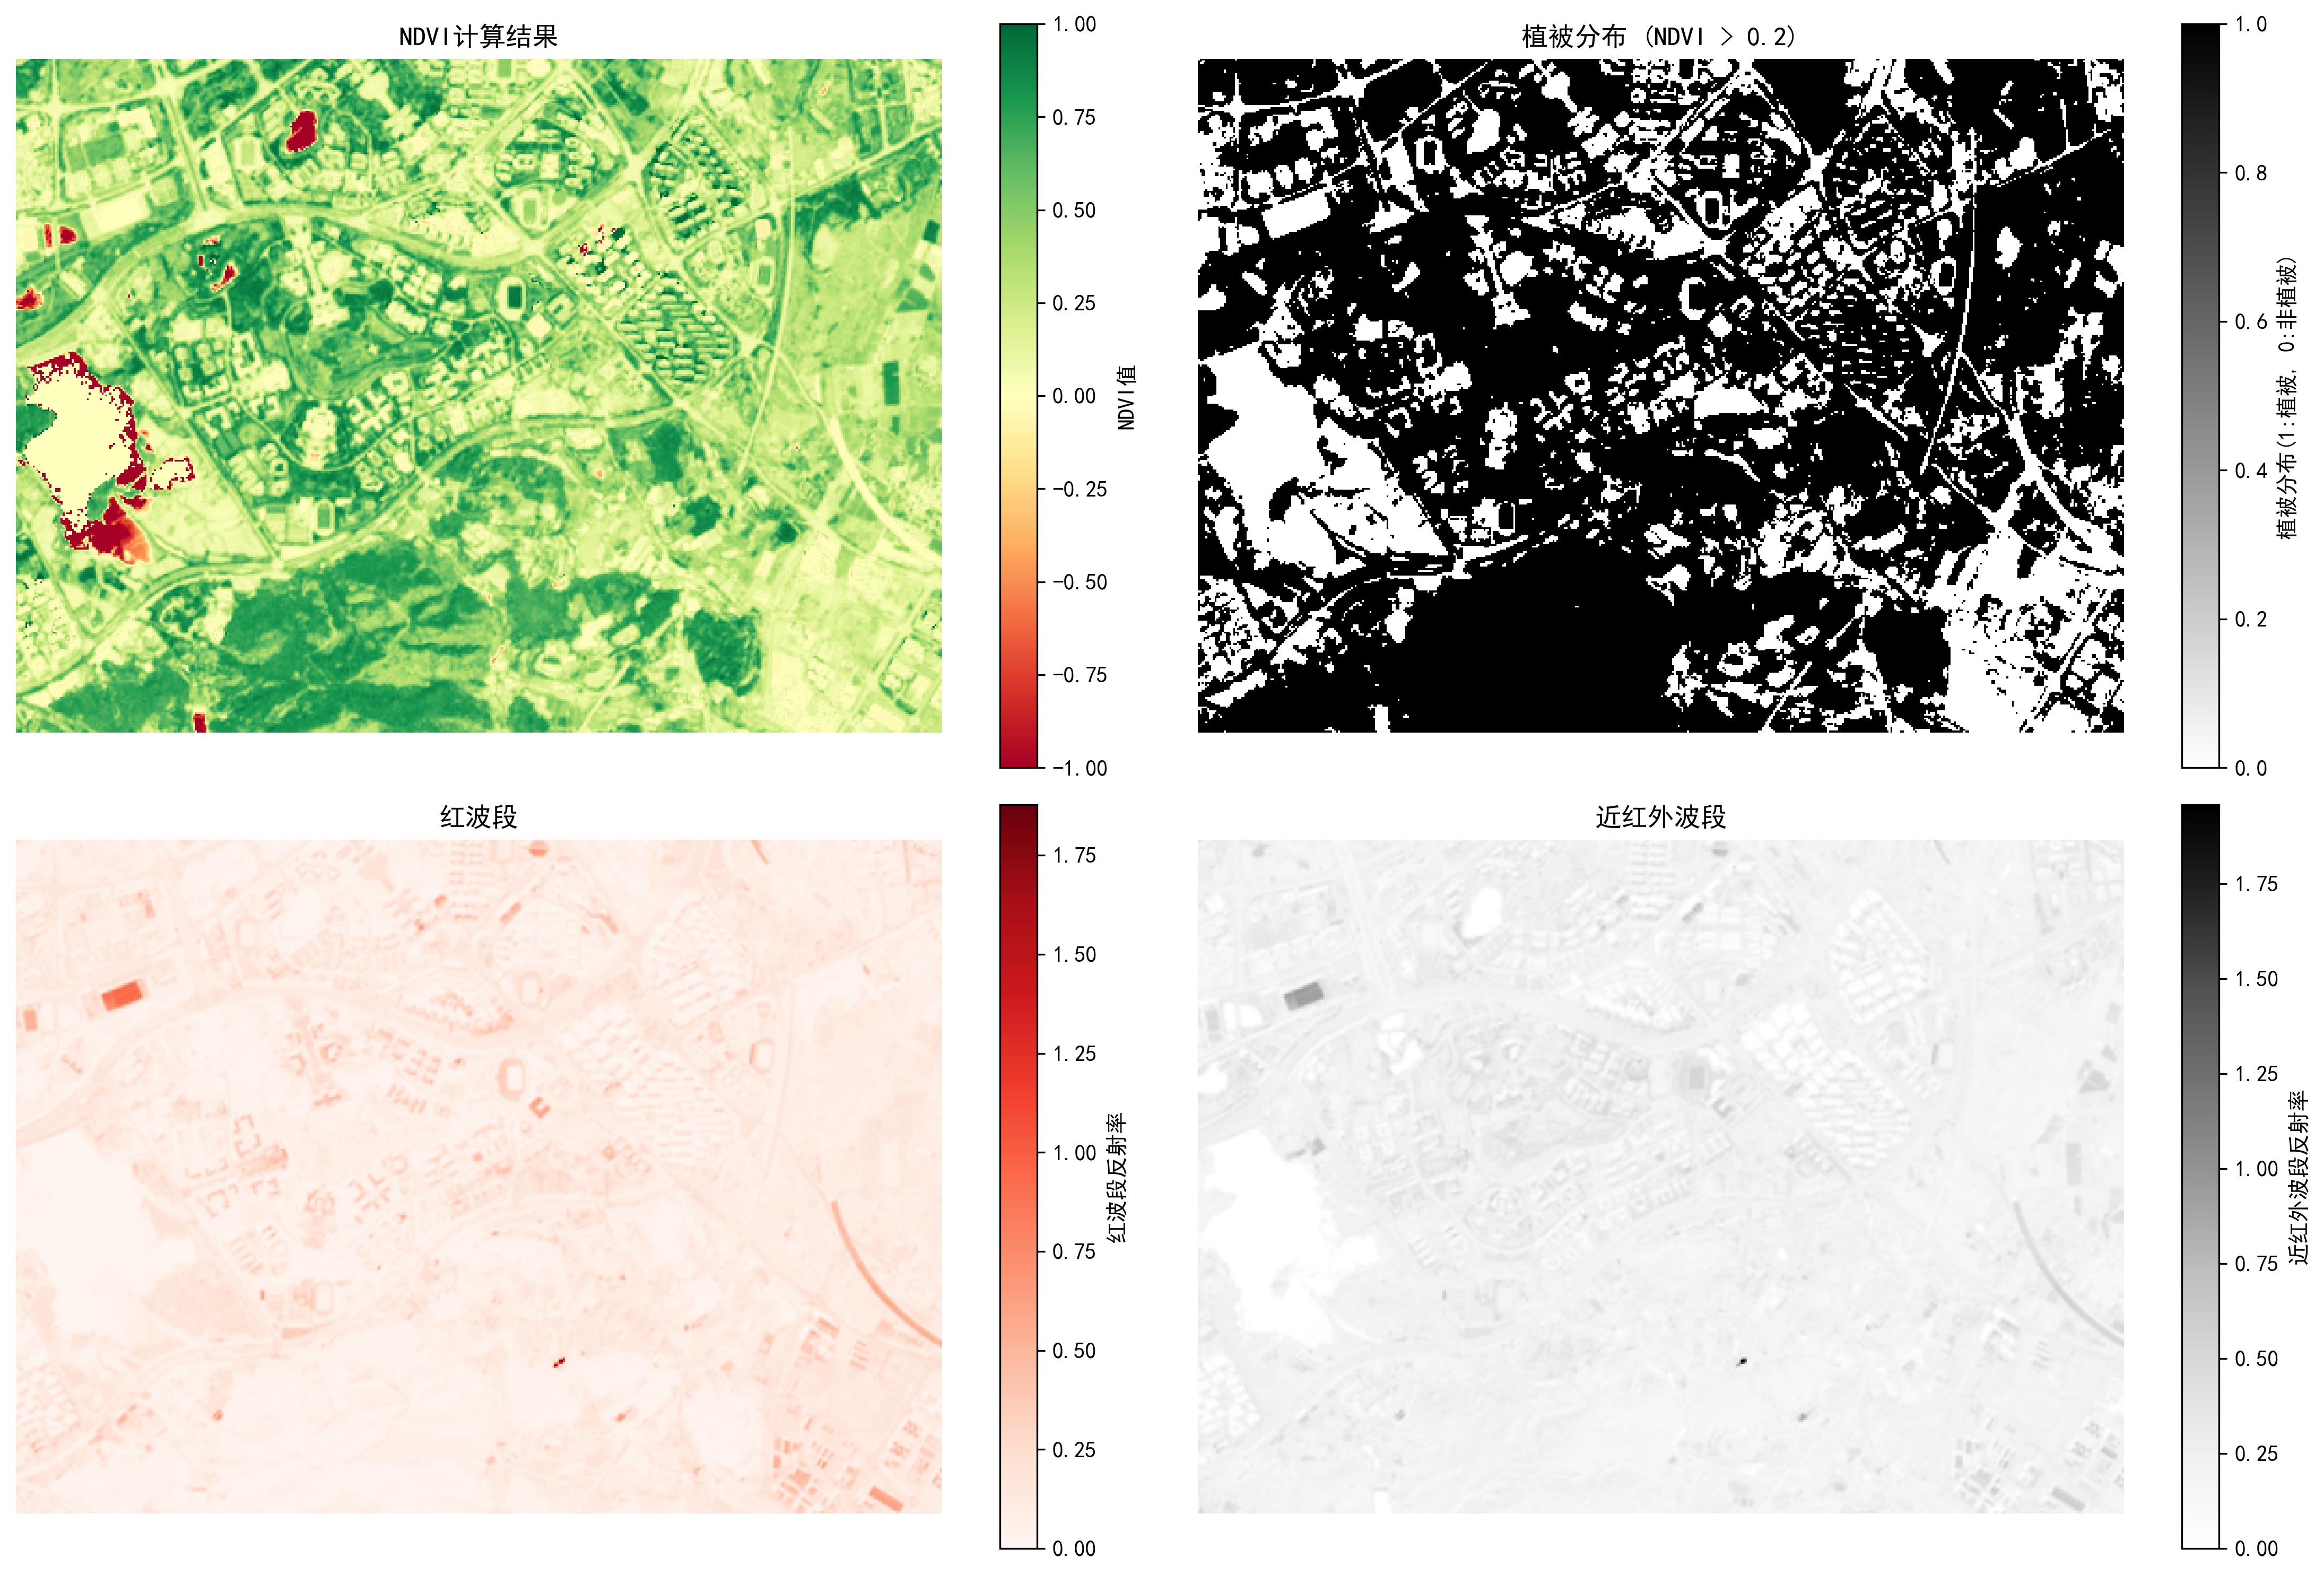
# 绘制 NDVI 计算结果
plt.subplot(221)
ndvi_plot = plt.imshow(ndvi, cmap='RdYlGn') # 使用红-黄-绿色彩映射
plt.colorbar(ndvi_plot, label='NDVI值')
plt.title('NDVI计算结果')
plt.axis('off')
# 绘制植被分布
plt.subplot(222)
veg_plot = plt.imshow(vegetation, cmap='binary') # 使用二值色彩映射
plt.colorbar(veg_plot, label='植被分布(1:植被, 0:非植被)')
plt.title(f'植被分布 (NDVI > {threshold})')
plt.axis('off')
# 绘制红波段
plt.subplot(223)
red_plot = plt.imshow(red, cmap='Reds') # 使用红色色彩映射
plt.colorbar(red_plot, label='红波段反射率')
plt.title('红波段')
plt.axis('off')
# 绘制近红外波段
plt.subplot(224)
nir_plot = plt.imshow(nir, cmap='Greys') # 使用灰色色彩映射
plt.colorbar(nir_plot, label='近红外波段反射率')
plt.title('近红外波段')
plt.axis('off')
# 调整布局并保存图像
plt.tight_layout()
plt.savefig(f"{output_path}/NDVI分析结果.png", dpi=300, bbox_inches='tight')
plt.show()
# 打印统计信息
print(f"NDVI计算完成!结果已保存至:{output_path}")
print(f"植被像元数量:{np.sum(vegetation)}")
print(f"植被覆盖率:{(np.sum(vegetation) / vegetation.size) * 100:.2f}%")
print(f"NDVI统计信息:")
print(f" 最小值:{np.min(ndvi):.3f}")
print(f" 最大值:{np.max(ndvi):.3f}")
print(f" 平均值:{np.mean(ndvi):.3f}")
print(f" 标准差:{np.std(ndvi):.3f}")
if __name__ == "__main__":
# 定义输入文件路径和输出目录
red_band = r'<红光波段文件路径>'
nir_band = r'<近红外波段文件路径>'
output_path = r'<结果输出路径>'
# 创建输出目录(如果不存在)
os.makedirs(output_path, exist_ok=True)
try:
# 调用函数计算 NDVI 并可视化结果
calculate_and_visualize_ndvi(red_band, nir_band, output_path, threshold=0.2)
except Exception as e:
# 捕获并打印错误信息
print(f"处理过程中出现错误: {str(e)}")
Comments NOTHING